SAP and mock shells: a prespecified check
C-QTc hysteresis check: a signed loop area on model residuals
Synthetic data only: simulated for this page; not trial data and not a regulatory deliverable.
Tools built: a small formalization of the standard C-QTc hysteresis check. The signed loop area is established (cyclicity analysis; the hysteresis-loop literature). This page computes it on residuals from the prespecified direct-effect model and documents its operating characteristics on synthetic data. It supplements, and does not replace, the prespecified C-QTc model or effect-compartment modeling.
- The SAP step this formalizes
- Statistic
- Why the model matters
- Operating characteristics
- Diurnal confound and the Day -1 check
- SAP text
- What it does not do
- Provenance and credit
The SAP step this formalizes
Concentration-QTc (C-QTc) analysis under ICH E14 Q&A (R3) (Q5.1) fits a prespecified model of ddQTcF (the change from baseline in QTcF minus the time-matched placebo mean) on plasma concentration, usually a linear mixed-effects model (Garnett et al. 2018). That model assumes the effect follows concentration with no delay. Before fitting it, the SAP checks for hysteresis: an effect that lags concentration, from distribution to the site of action, a metabolite or slow channel kinetics.
The check is usually visual. The registry SAPs listed under credit assess it with joint plots of the mean ddQTcF and mean concentration by time and a "hysteresis plot", and consider other models if "the curve of the hysteresis plot shows a counterclockwise loop" and the time of the peak effect is more than 1 hour from tmax. The CiPA Phase 1 SAP adds a formal one-sided Wilcoxon test at 1% alongside the same 1 hour rule. This page replaces the visual judgment with one number per participant and a test whose size and power are documented on synthetic data, and keeps the tmax gap beside it.
Statistic
Data. For each active participant i: actual times t1 < ... < tm over the dosing interval, concentration Cij and ddQTcFij. Concentration is scaled to the participant's own Cmax, xij = Cij / maxj Cij (prespecified). For each placebo participant k in the pooled placebo group: dQTcFkj at the same nominal times, whose mean at each time, pbarj, is subtracted from every active participant's dQTcF to give ddQTcF.
Direct-effect model (prespecified, no time factor): ddQTcFij = f(Cij; theta) + bi + eij, with f linear (theta0 + theta1 C), or Emax (E0 + Emax C / (EC50 + C)) if the SAP's linearity check selects it. Residuals rij = ddQTcFij - f-hat(Cij) - b-hati.
Signed area of the closed path (xi1, ri1), ..., (xim, rim), back to the start (the shoelace formula, index m + 1 = 1):
Ai = ½ Σj=1..m (xj rj+1 - xj+1 rj)
Ai > 0 means the loop runs counterclockwise: the effect is lower on the way up than on the way down, so it lags concentration. Ai is in ms. It is also the off-diagonal of the antisymmetric part of the lag-1 cross-moment Γ = Σj zj zj+1T with zj = (xj, rj), so reversing time flips its sign exactly.
Why the test must allow for the placebo mean. The statistic is A-bar, the mean of Ai over the active participants. Under the null (no delay given f, with errors independent of C and symmetric), each Ai is symmetric about 0, because it is linear in the errors; autocorrelation within a participant is allowed. The Ai are not independent, though: every active participant's ddQTcF subtracts the same placebo mean, so every Ai carries minus the area of its x path against the same placebo-mean noise. Because the area is bilinear, A-bar is exactly the mean active area on dQTcF minus the mean of hk, where hk is the signed area of placebo participant k's dQTcF against the active participants' mean x profile (checked to 1e-10 in the tests). Its variance therefore has a placebo part that shrinks with the number of placebo participants, not the number of active ones. A participant-level sign-flip test of the Ai leaves that part out: with 32 active and 8 placebo participants and no delay, it rejected in 0.236 (MCSE 0.013) of trials at a nominal 0.05.
Test (pooled placebo, as in SAD and MAD studies). t = A-bar / SE, with SE2 = s2A / n + s2h / npbo, where s2A is the sample variance of the Ai (the shared term is nearly the same for every participant, so it nearly drops out of it) and s2h that of the hk, computed on each placebo participant's deviation from pbar. The degrees of freedom are Welch-Satterthwaite. This is a two-group (Welch) comparison; its size is approximate, not exact, and was checked on the synthetic designs below. One-sided for counterclockwise loops; two-sided also catches clockwise loops (tolerance). Secondary: a parametric bootstrap from the fitted direct-effect model that also draws the placebo-mean noise (B = 999).
When the sign-flip test is exact. If each participant's ddQTcF is corrected by their own placebo profile (a crossover with a placebo period), nothing is shared and the Ai are independent. A participant-level sign-flip test is then exact: all 2n sign vectors when n ≤ 20, otherwise B = 9,999 random sign vectors with p = (1 + #{A-bar* ≥ A-bar}) / (B + 1).
Reported beside the test: A-bar in ms with a 95% CI from the same SE and degrees of freedom, the model used for f, and the tmax gap (the time of peak ddQTcF minus the median tmax, flagged when it exceeds 1 hour). Two versions of the gap are computed: the median over participants of the time of peak ddQTcF, and the time of the peak of the mean ddQTcF profile, as in the registry SAPs.
One synthetic trial (32 active and 8 placebo participants, seed 20261025) through hysteresis_check(), the function the mock shells mirror:
| Dataset (32 + 8 placebo) | f | A-bar, ms (95% CI); SE (df) | p, one / two-sided | Bootstrap p | tmax gap, h (individual / mean) | Day -1 A-bar, ms |
|---|---|---|---|---|---|---|
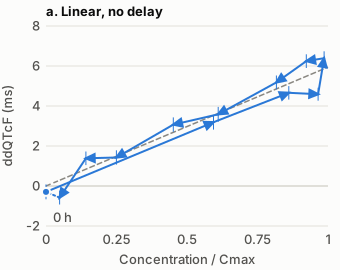
| Linear, no delay | linear | -0.25 (-3.11, 2.61) SE 1.30 (df 10.6) | 0.5751 / 0.8498 | 0.549 | -0.5 / 2.0 | 2.06 (p 0.175) |
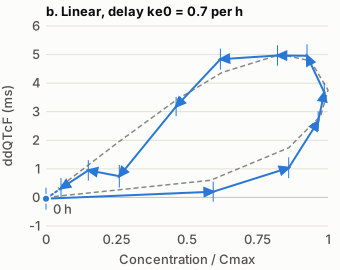
| Linear, ke0 = 0.7 per h | linear | 3.17 (0.65, 5.69) SE 1.15 (df 11.6) | 0.0090 / 0.0181 | 0.009 | 1.0 / 0.0 | -0.65 (p 0.688) |
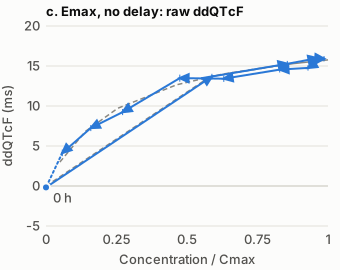
| Emax, no delay: raw area | linear | 1.85 (-0.66, 4.35) SE 1.14 (df 11.3) | 0.0665 / 0.1329 | 0.071 | 0.0 / -0.5 | 1.92 (p 0.138) |
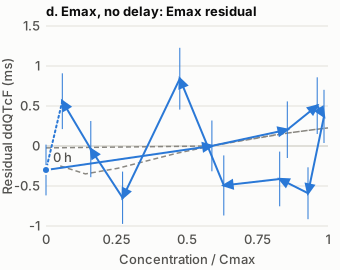
| Emax, no delay: Emax residual area | emax | -0.56 (-3.09, 1.97) SE 1.16 (df 12.1) | 0.6820 / 0.6360 | 0.685 | 0.0 / -0.5 | 1.92 (p 0.138) |
Why the model matters
The closed-path area of any straight line (x, a + b x) is exactly 0, and a participant-level constant adds no area. So under a linear f the residual area equals the raw area of ddQTcF itself, whatever the fitted slope and intercepts. A curved direct effect is different. Sampled at 12 times, the path up and the path down pass through different points of the curve and the closing segment cuts a chord, so the raw path encloses area with no delay at all: 1.40 ms for the noise-free typical participant under the Emax model, against -0.002 ms on a 0.01 h grid and 2.34 ms for a real delay (linear, ke0 = 0.7 per h).
With noise, 32 active and 8 placebo participants, the raw-area test rejects in 0.296 (MCSE 0.014) of trials with an Emax direct effect and no delay. On residuals from the Emax fit the rate is 0.036 (MCSE 0.006), and 0.039 two-sided. The CiPA-style linearity check (a quadratic term tested two-sided at 5%, then the Emax model kept when its AIC is lower) picks Emax in 0.997 of these trials and 0.139 of the linear ones, and the area on residuals from the f it selects rejects in 0.036 (Emax truth) and 0.037 (linear truth); the MCSE of these rates is at most 0.016. When the Emax effect is also delayed (ke0 = 0.7 per h), both areas keep their power: 0.999 raw and 0.986 on Emax residuals. The residual area is conditional on the prespecified form: it removes the curvature the model describes, not curvature it misses.
F2. Example loops. Solid: the mean over 200 simulated active participants, corrected by the mean of 200 placebo participants (more than a trial has, so that the expected shape is visible), in time order (arrows; whiskers are plus or minus one standard error; the dotted segment closes the path from 24 h back to 0 h). Dashed: the noise-free typical participant (ka 1.2 per h, ke 0.15 per h). A single noisy participant's loop is mostly noise here (residual SD 5 ms against a peak effect of about 6 ms under the linear model); the test pools the signed areas across participants. Standalone files: a, b, c, d.
Operating characteristics
Synthetic known-answer design (32 scenarios; 1,000 replicates each, so the MCSE of a rate near 0.05 is 0.007; scenario k uses seed 20261025 + k, listed in T1 and in the CSV). 32 active participants and a pooled placebo group of 8 (for example, four cohorts of 8 active and 2 placebo participants), sampled at 0, 0.5, 1, 1.5, 2, 3, 4, 6, 8, 12, 16 and 24 h. One-compartment oral PK with ka = 1.2 exp(N(0, 0.32)) per h, ke = 0.15 exp(N(0, 0.32)) per h and D/V = 2; an effect compartment dCe/dt = ke0 (C - Ce), solved analytically. Every participant's dQTcF carries a common daily rhythm, 4 sin(2π(t + 18)/24) ms, and N(0, 52) noise; active participants add a drug effect of 4 ms × Ce, or 20 Ce / (Ce + 0.4) ms for the Emax variant. ddQTcF is active dQTcF minus the time-matched placebo mean, as in the mock shells. One-sided alpha 0.05.
- KA1, size. Linear model, direct effect: the placebo-adjusted t-test rejects in 0.046 (MCSE 0.007); two-sided, 0.050; the parametric bootstrap, 0.048. With 16 and 32 placebo participants it rejects in 0.053 and 0.055. The one-sample sign-flip test on the same areas rejects in 0.236, 0.184 and 0.113: too often whenever the placebo mean is shared. In the crossover variant, where each participant's ddQTcF uses their own placebo period, the sign-flip test is exact and rejects in 0.048 (MCSE 0.007); two-sided, 0.056.
- KA2, curvature. Emax, no delay: raw area 0.296, Emax-residual area 0.036, bootstrap from the Emax fit 0.052 (MCSE at most 0.016).
- KA3, power. Linear model with delay, 32 active and 8 placebo participants: 0.254 at ke0 = 2 per h (equilibration half-life 0.35 h), 0.489 (MCSE 0.016) at 0.7 per h (1 h) and 0.551 at 0.35 per h (2 h). Power rises little beyond ke0 = 0.7 per h (F1), because a still slower effect site makes the effect itself smaller and flatter. The placebo group sets most of the noise: at ke0 = 0.7 per h power is 0.707 with 16 placebo participants, 0.876 with 32, and 0.876 in the crossover variant with the sign-flip test (MCSE at most 0.016).
- KA4, one SAD cohort. 6 active participants against the pooled placebo group of 8: size 0.048 (MCSE 0.007), against 0.084 for the one-sample sign-flip test, and power only 0.315 at ke0 = 0.7 per h and 0.352 at 0.35 per h. A cohort this size cannot rule a delay in or out; pooling the active cohorts, as the C-QTc model does, gives the 32-participant rows.
- KA5, tolerance. E = 4 C - 3 M with dM/dt = 0.35 (C - M) produces clockwise loops (noise-free area -1.86 ms). The one-sided test rejects in 0.001 (MCSE 0.001) and the two-sided test in 0.262 (MCSE 0.014).
- The tmax gap rule fires in 0.123 (individual peaks) and 0.165 (mean profile) of trials with no delay, and in 0.634 and 0.579 at ke0 = 0.7 per h, where the area test rejects in 0.489 (MCSE 0.016). In a single SAD cohort of 6 with no delay it fires in 0.297 and 0.277. It is reported beside the test, not used as the decision.
32 active + 8 placebo 32 active + 32 placebo 6 active (one SAD cohort) + 8 placebo
| Method | Rate | MCSE | Exact 95% CI |
|---|---|---|---|
| KA1: Linear direct effect, no delay (32 active, 8 placebo; seed 20261026) | |||
| Signed area, placebo-adjusted t, one-sided (raw ddQTcF; equals the linear-f residual area) | 0.046 | 0.007 | 0.034 to 0.061 |
| Signed area, placebo-adjusted t, two-sided | 0.050 | 0.007 | 0.037 to 0.065 |
| Signed area, participant-level sign-flip, one-sided (exact only with independent ddQTcF errors) | 0.236 | 0.013 | 0.210 to 0.264 |
| Signed area, participant-level sign-flip, two-sided | 0.346 | 0.015 | 0.317 to 0.376 |
| Linearity check selects Emax (selection rate, not a test) | 0.139 | 0.011 | 0.118 to 0.162 |
| Area on residuals from the f the linearity check selects, one-sided | 0.037 | 0.006 | 0.026 to 0.051 |
| Parametric bootstrap from the fitted model, one-sided (secondary) | 0.048 | 0.007 | 0.036 to 0.063 |
| tmax gap > 1 h, median of individual peak times (rate the rule fires) | 0.123 | 0.010 | 0.103 to 0.145 |
| tmax gap > 1 h, peak of the mean profile (rate the rule fires) | 0.165 | 0.012 | 0.142 to 0.190 |
| Day -1 pseudo-loop check, placebo-adjusted t, two-sided | 0.050 | 0.007 | 0.037 to 0.065 |
| Day -1 pseudo-loop check, placebo-adjusted t, one-sided | 0.055 | 0.007 | 0.042 to 0.071 |
| Day -1 pseudo-loop check, sign-flip, two-sided | 0.360 | 0.015 | 0.330 to 0.391 |
| KA1-p16: Linear direct effect, no delay; 16 placebo (32 active, 16 placebo; seed 20261027) | |||
| Signed area, placebo-adjusted t, one-sided (raw ddQTcF; equals the linear-f residual area) | 0.053 | 0.007 | 0.040 to 0.069 |
| Signed area, placebo-adjusted t, two-sided | 0.054 | 0.007 | 0.041 to 0.070 |
| Signed area, participant-level sign-flip, one-sided (exact only with independent ddQTcF errors) | 0.184 | 0.012 | 0.160 to 0.209 |
| Signed area, participant-level sign-flip, two-sided | 0.261 | 0.014 | 0.234 to 0.289 |
| KA1-p32: Linear direct effect, no delay; 32 placebo (32 active, 32 placebo; seed 20261028) | |||
| Signed area, placebo-adjusted t, one-sided (raw ddQTcF; equals the linear-f residual area) | 0.055 | 0.007 | 0.042 to 0.071 |
| Signed area, placebo-adjusted t, two-sided | 0.048 | 0.007 | 0.036 to 0.063 |
| Signed area, participant-level sign-flip, one-sided (exact only with independent ddQTcF errors) | 0.113 | 0.010 | 0.094 to 0.134 |
| Signed area, participant-level sign-flip, two-sided | 0.138 | 0.011 | 0.117 to 0.161 |
| KA1-within: Linear direct effect, no delay; crossover, own placebo period (32 active, each with their own placebo period; seed 20261029) | |||
| Signed area, placebo-adjusted t, one-sided (raw ddQTcF; equals the linear-f residual area) | 0.047 | 0.007 | 0.035 to 0.062 |
| Signed area, placebo-adjusted t, two-sided | 0.053 | 0.007 | 0.040 to 0.069 |
| Signed area, participant-level sign-flip, one-sided (exact only with independent ddQTcF errors) | 0.048 | 0.007 | 0.036 to 0.063 |
| Signed area, participant-level sign-flip, two-sided | 0.056 | 0.007 | 0.043 to 0.072 |
| Day -1 pseudo-loop check, sign-flip, two-sided | 0.050 | 0.007 | 0.037 to 0.065 |
| KA2: Emax direct effect, no delay (32 active, 8 placebo; seed 20261030) | |||
| Signed area, placebo-adjusted t, one-sided (raw ddQTcF; equals the linear-f residual area) | 0.296 | 0.014 | 0.268 to 0.325 |
| Signed area, placebo-adjusted t, two-sided | 0.206 | 0.013 | 0.181 to 0.232 |
| Emax-residual area, placebo-adjusted t, one-sided | 0.036 | 0.006 | 0.025 to 0.050 |
| Emax-residual area, placebo-adjusted t, two-sided | 0.039 | 0.006 | 0.028 to 0.053 |
| Linearity check selects Emax (selection rate, not a test) | 0.997 | 0.002 | 0.991 to 0.999 |
| Area on residuals from the f the linearity check selects, one-sided | 0.036 | 0.006 | 0.025 to 0.050 |
| Parametric bootstrap from the fitted model, one-sided (secondary) | 0.052 | 0.007 | 0.039 to 0.068 |
| tmax gap > 1 h, median of individual peak times (rate the rule fires) | 0.084 | 0.009 | 0.068 to 0.103 |
| tmax gap > 1 h, peak of the mean profile (rate the rule fires) | 0.204 | 0.013 | 0.179 to 0.230 |
| KA2-delay: Emax effect, delay ke0 = 0.7 per h (32 active, 8 placebo; seed 20261031) | |||
| Signed area, placebo-adjusted t, one-sided (raw ddQTcF; equals the linear-f residual area) | 0.999 | 0.001 | 0.994 to 1.000 |
| Signed area, placebo-adjusted t, two-sided | 0.995 | 0.002 | 0.988 to 0.998 |
| Emax-residual area, placebo-adjusted t, one-sided | 0.986 | 0.004 | 0.977 to 0.992 |
| Emax-residual area, placebo-adjusted t, two-sided | 0.939 | 0.008 | 0.922 to 0.953 |
| Linearity check selects Emax (selection rate, not a test) | 0.966 | 0.006 | 0.953 to 0.976 |
| Area on residuals from the f the linearity check selects, one-sided | 0.986 | 0.004 | 0.977 to 0.992 |
| KA3-k4: Linear, delay ke0 = 4 per h (32 active, 8 placebo; seed 20261032) | |||
| Signed area, placebo-adjusted t, one-sided (raw ddQTcF; equals the linear-f residual area) | 0.159 | 0.012 | 0.137 to 0.183 |
| Signed area, placebo-adjusted t, two-sided | 0.101 | 0.009 | 0.083 to 0.121 |
| Parametric bootstrap from the fitted model, one-sided (secondary) | 0.159 | 0.012 | 0.137 to 0.183 |
| tmax gap > 1 h, median of individual peak times (rate the rule fires) | 0.210 | 0.013 | 0.185 to 0.237 |
| tmax gap > 1 h, peak of the mean profile (rate the rule fires) | 0.238 | 0.013 | 0.212 to 0.266 |
| KA3-k2: Linear, delay ke0 = 2 per h (32 active, 8 placebo; seed 20261033) | |||
| Signed area, placebo-adjusted t, one-sided (raw ddQTcF; equals the linear-f residual area) | 0.254 | 0.014 | 0.227 to 0.282 |
| Signed area, placebo-adjusted t, two-sided | 0.168 | 0.012 | 0.145 to 0.193 |
| Parametric bootstrap from the fitted model, one-sided (secondary) | 0.282 | 0.014 | 0.254 to 0.311 |
| tmax gap > 1 h, median of individual peak times (rate the rule fires) | 0.287 | 0.014 | 0.259 to 0.316 |
| tmax gap > 1 h, peak of the mean profile (rate the rule fires) | 0.314 | 0.015 | 0.285 to 0.344 |
| KA3-k1: Linear, delay ke0 = 1 per h (32 active, 8 placebo; seed 20261034) | |||
| Signed area, placebo-adjusted t, one-sided (raw ddQTcF; equals the linear-f residual area) | 0.427 | 0.016 | 0.396 to 0.458 |
| Signed area, placebo-adjusted t, two-sided | 0.326 | 0.015 | 0.297 to 0.356 |
| Parametric bootstrap from the fitted model, one-sided (secondary) | 0.480 | 0.016 | 0.449 to 0.511 |
| tmax gap > 1 h, median of individual peak times (rate the rule fires) | 0.505 | 0.016 | 0.473 to 0.536 |
| tmax gap > 1 h, peak of the mean profile (rate the rule fires) | 0.491 | 0.016 | 0.460 to 0.522 |
| KA3-k0.7: Linear, delay ke0 = 0.7 per h (32 active, 8 placebo; seed 20261035) | |||
| Signed area, placebo-adjusted t, one-sided (raw ddQTcF; equals the linear-f residual area) | 0.489 | 0.016 | 0.458 to 0.520 |
| Signed area, placebo-adjusted t, two-sided | 0.353 | 0.015 | 0.323 to 0.384 |
| Parametric bootstrap from the fitted model, one-sided (secondary) | 0.534 | 0.016 | 0.502 to 0.565 |
| tmax gap > 1 h, median of individual peak times (rate the rule fires) | 0.634 | 0.015 | 0.603 to 0.664 |
| tmax gap > 1 h, peak of the mean profile (rate the rule fires) | 0.579 | 0.016 | 0.548 to 0.610 |
| KA3-k0.5: Linear, delay ke0 = 0.5 per h (32 active, 8 placebo; seed 20261036) | |||
| Signed area, placebo-adjusted t, one-sided (raw ddQTcF; equals the linear-f residual area) | 0.553 | 0.016 | 0.522 to 0.584 |
| Signed area, placebo-adjusted t, two-sided | 0.405 | 0.015 | 0.374 to 0.436 |
| Parametric bootstrap from the fitted model, one-sided (secondary) | 0.612 | 0.015 | 0.581 to 0.642 |
| tmax gap > 1 h, median of individual peak times (rate the rule fires) | 0.742 | 0.014 | 0.714 to 0.769 |
| tmax gap > 1 h, peak of the mean profile (rate the rule fires) | 0.648 | 0.015 | 0.618 to 0.678 |
| KA3-k0.35: Linear, delay ke0 = 0.35 per h (32 active, 8 placebo; seed 20261037) | |||
| Signed area, placebo-adjusted t, one-sided (raw ddQTcF; equals the linear-f residual area) | 0.551 | 0.016 | 0.520 to 0.582 |
| Signed area, placebo-adjusted t, two-sided | 0.411 | 0.016 | 0.380 to 0.442 |
| Parametric bootstrap from the fitted model, one-sided (secondary) | 0.581 | 0.016 | 0.550 to 0.612 |
| tmax gap > 1 h, median of individual peak times (rate the rule fires) | 0.815 | 0.012 | 0.789 to 0.839 |
| tmax gap > 1 h, peak of the mean profile (rate the rule fires) | 0.727 | 0.014 | 0.698 to 0.754 |
| KA3-k4-p32: Linear, delay ke0 = 4 per h; 32 placebo (32 active, 32 placebo; seed 20261038) | |||
| Signed area, placebo-adjusted t, one-sided (raw ddQTcF; equals the linear-f residual area) | 0.254 | 0.014 | 0.227 to 0.282 |
| Signed area, placebo-adjusted t, two-sided | 0.167 | 0.012 | 0.144 to 0.192 |
| KA3-k2-p32: Linear, delay ke0 = 2 per h; 32 placebo (32 active, 32 placebo; seed 20261039) | |||
| Signed area, placebo-adjusted t, one-sided (raw ddQTcF; equals the linear-f residual area) | 0.557 | 0.016 | 0.526 to 0.588 |
| Signed area, placebo-adjusted t, two-sided | 0.424 | 0.016 | 0.393 to 0.455 |
| KA3-k1-p32: Linear, delay ke0 = 1 per h; 32 placebo (32 active, 32 placebo; seed 20261040) | |||
| Signed area, placebo-adjusted t, one-sided (raw ddQTcF; equals the linear-f residual area) | 0.819 | 0.012 | 0.794 to 0.842 |
| Signed area, placebo-adjusted t, two-sided | 0.706 | 0.014 | 0.677 to 0.734 |
| KA3-k0.7-p32: Linear, delay ke0 = 0.7 per h; 32 placebo (32 active, 32 placebo; seed 20261041) | |||
| Signed area, placebo-adjusted t, one-sided (raw ddQTcF; equals the linear-f residual area) | 0.876 | 0.010 | 0.854 to 0.896 |
| Signed area, placebo-adjusted t, two-sided | 0.781 | 0.013 | 0.754 to 0.806 |
| KA3-k0.5-p32: Linear, delay ke0 = 0.5 per h; 32 placebo (32 active, 32 placebo; seed 20261042) | |||
| Signed area, placebo-adjusted t, one-sided (raw ddQTcF; equals the linear-f residual area) | 0.907 | 0.009 | 0.887 to 0.924 |
| Signed area, placebo-adjusted t, two-sided | 0.844 | 0.011 | 0.820 to 0.866 |
| KA3-k0.35-p32: Linear, delay ke0 = 0.35 per h; 32 placebo (32 active, 32 placebo; seed 20261043) | |||
| Signed area, placebo-adjusted t, one-sided (raw ddQTcF; equals the linear-f residual area) | 0.906 | 0.009 | 0.886 to 0.923 |
| Signed area, placebo-adjusted t, two-sided | 0.835 | 0.012 | 0.810 to 0.858 |
| KA3-k0.7-p16: Linear, delay ke0 = 0.7 per h; 16 placebo (32 active, 16 placebo; seed 20261044) | |||
| Signed area, placebo-adjusted t, one-sided (raw ddQTcF; equals the linear-f residual area) | 0.707 | 0.014 | 0.678 to 0.735 |
| Signed area, placebo-adjusted t, two-sided | 0.607 | 0.015 | 0.576 to 0.637 |
| KA3-k0.7-within: Linear, delay ke0 = 0.7 per h; crossover, own placebo period (32 active, each with their own placebo period; seed 20261045) | |||
| Signed area, participant-level sign-flip, one-sided (exact only with independent ddQTcF errors) | 0.876 | 0.010 | 0.854 to 0.896 |
| Signed area, participant-level sign-flip, two-sided | 0.787 | 0.013 | 0.760 to 0.812 |
| KA4-direct: One SAD cohort of 6, linear direct effect (6 active, 8 placebo; seed 20261046) | |||
| Signed area, placebo-adjusted t, one-sided (raw ddQTcF; equals the linear-f residual area) | 0.048 | 0.007 | 0.036 to 0.063 |
| Signed area, placebo-adjusted t, two-sided | 0.038 | 0.006 | 0.027 to 0.052 |
| Signed area, participant-level sign-flip, one-sided (exact only with independent ddQTcF errors) | 0.084 | 0.009 | 0.068 to 0.103 |
| Signed area, participant-level sign-flip, two-sided | 0.061 | 0.008 | 0.047 to 0.078 |
| tmax gap > 1 h, median of individual peak times (rate the rule fires) | 0.297 | 0.014 | 0.269 to 0.326 |
| tmax gap > 1 h, peak of the mean profile (rate the rule fires) | 0.277 | 0.014 | 0.249 to 0.306 |
| KA4-k4: One SAD cohort of 6, ke0 = 4 per h (6 active, 8 placebo; seed 20261047) | |||
| Signed area, placebo-adjusted t, one-sided (raw ddQTcF; equals the linear-f residual area) | 0.086 | 0.009 | 0.069 to 0.105 |
| Signed area, placebo-adjusted t, two-sided | 0.059 | 0.007 | 0.045 to 0.075 |
| KA4-k2: One SAD cohort of 6, ke0 = 2 per h (6 active, 8 placebo; seed 20261048) | |||
| Signed area, placebo-adjusted t, one-sided (raw ddQTcF; equals the linear-f residual area) | 0.192 | 0.013 | 0.168 to 0.218 |
| Signed area, placebo-adjusted t, two-sided | 0.114 | 0.010 | 0.095 to 0.135 |
| KA4-k1: One SAD cohort of 6, ke0 = 1 per h (6 active, 8 placebo; seed 20261049) | |||
| Signed area, placebo-adjusted t, one-sided (raw ddQTcF; equals the linear-f residual area) | 0.288 | 0.014 | 0.260 to 0.317 |
| Signed area, placebo-adjusted t, two-sided | 0.189 | 0.012 | 0.165 to 0.215 |
| KA4-k0.7: One SAD cohort of 6, ke0 = 0.7 per h (6 active, 8 placebo; seed 20261050) | |||
| Signed area, placebo-adjusted t, one-sided (raw ddQTcF; equals the linear-f residual area) | 0.315 | 0.015 | 0.286 to 0.345 |
| Signed area, placebo-adjusted t, two-sided | 0.213 | 0.013 | 0.188 to 0.240 |
| KA4-k0.5: One SAD cohort of 6, ke0 = 0.5 per h (6 active, 8 placebo; seed 20261051) | |||
| Signed area, placebo-adjusted t, one-sided (raw ddQTcF; equals the linear-f residual area) | 0.345 | 0.015 | 0.316 to 0.375 |
| Signed area, placebo-adjusted t, two-sided | 0.209 | 0.013 | 0.184 to 0.235 |
| KA4-k0.35: One SAD cohort of 6, ke0 = 0.35 per h (6 active, 8 placebo; seed 20261052) | |||
| Signed area, placebo-adjusted t, one-sided (raw ddQTcF; equals the linear-f residual area) | 0.352 | 0.015 | 0.322 to 0.383 |
| Signed area, placebo-adjusted t, two-sided | 0.241 | 0.013 | 0.215 to 0.269 |
| tmax gap > 1 h, median of individual peak times (rate the rule fires) | 0.764 | 0.013 | 0.736 to 0.790 |
| tmax gap > 1 h, peak of the mean profile (rate the rule fires) | 0.716 | 0.014 | 0.687 to 0.744 |
| KA5: Tolerance (gamma = 3, k_m = 0.35 per h): clockwise (32 active, 8 placebo; seed 20261053) | |||
| Signed area, placebo-adjusted t, one-sided (raw ddQTcF; equals the linear-f residual area) | 0.001 | 0.001 | 0.000 to 0.006 |
| Signed area, placebo-adjusted t, two-sided | 0.262 | 0.014 | 0.235 to 0.290 |
| NC1-phi0: Residual time pattern, phi = 0 h (32 active, 8 placebo; seed 20261054) | |||
| Signed area, placebo-adjusted t, one-sided (raw ddQTcF; equals the linear-f residual area) | 0.165 | 0.012 | 0.142 to 0.190 |
| Signed area, placebo-adjusted t, two-sided | 0.105 | 0.010 | 0.087 to 0.126 |
| Day -1 pseudo-loop check, placebo-adjusted t, two-sided | 0.092 | 0.009 | 0.075 to 0.112 |
| Day -1 pseudo-loop check, placebo-adjusted t, one-sided | 0.145 | 0.011 | 0.124 to 0.168 |
| NC1-phi6: Residual time pattern, phi = 6 h (32 active, 8 placebo; seed 20261055) | |||
| Signed area, placebo-adjusted t, one-sided (raw ddQTcF; equals the linear-f residual area) | 0.000 | n/a | 0.000 to 0.004 |
| Signed area, placebo-adjusted t, two-sided | 0.603 | 0.015 | 0.572 to 0.633 |
| Day -1 pseudo-loop check, placebo-adjusted t, two-sided | 0.576 | 0.016 | 0.545 to 0.607 |
| Day -1 pseudo-loop check, placebo-adjusted t, one-sided | 0.000 | n/a | 0.000 to 0.004 |
| NC1-phi12: Residual time pattern, phi = 12 h (32 active, 8 placebo; seed 20261056) | |||
| Signed area, placebo-adjusted t, one-sided (raw ddQTcF; equals the linear-f residual area) | 0.012 | 0.003 | 0.006 to 0.021 |
| Signed area, placebo-adjusted t, two-sided | 0.103 | 0.010 | 0.085 to 0.123 |
| Day -1 pseudo-loop check, placebo-adjusted t, two-sided | 0.112 | 0.010 | 0.093 to 0.133 |
| Day -1 pseudo-loop check, placebo-adjusted t, one-sided | 0.008 | 0.003 | 0.004 to 0.016 |
| NC1-phi18: Residual time pattern, phi = 18 h (32 active, 8 placebo; seed 20261057) | |||
| Signed area, placebo-adjusted t, one-sided (raw ddQTcF; equals the linear-f residual area) | 0.701 | 0.015 | 0.672 to 0.729 |
| Signed area, placebo-adjusted t, two-sided | 0.557 | 0.016 | 0.526 to 0.588 |
| Day -1 pseudo-loop check, placebo-adjusted t, two-sided | 0.564 | 0.016 | 0.533 to 0.595 |
| Day -1 pseudo-loop check, placebo-adjusted t, one-sided | 0.708 | 0.014 | 0.679 to 0.736 |
Diurnal confound and the Day -1 check
QTc has a daily rhythm. The time-matched placebo correction removes the part that active and placebo participants share: every simulated trial carries the common 4 ms rhythm above, and it never reaches ddQTcF (the tests check this to 1e-12). A time pattern the active participants do not share with the placebo group stays in ddQTcF, for example when a cohort's ECGs fall at different clock times from those of the placebo participants it is compared with. It can fake a loop or hide one, depending on where its peak falls relative to tmax. NC1 adds 3 sin(2π(t + phi)/24) ms to the active participants only, on Day 1 and Day -1, under the linear direct-effect model: the one-sided test rejects in 0.165 (MCSE 0.012) of trials at phi = 0 h, 0.701 at phi = 18 h and 0.000 at phi = 6 h (a clockwise artifact; two-sided 0.603), against 0.046 (MCSE 0.007) without it. This is why the SAP requires a time-matched placebo correction from participants studied alongside the active ones.
NC2, the Day -1 check. Pair each active participant's Day -1 time-matched QTcF (no drug, centered within the participant, minus the placebo group's centered Day -1 mean, as on Day 1) with that participant's Day 1 xj, compute the same signed area and test it the same way, two-sided. With no drug on Day -1, any loop it shows comes from timing alone. Without a residual pattern it keeps nominal size: 0.050 (MCSE 0.007). A one-sample sign-flip test of the same areas rejects in 0.360, too often for the same reason as on Day 1. It is a weak detector. It flags the pattern in 0.564 of trials at phi = 18 h, where the Day 1 one-sided test rejects in 0.701, and in 0.576 at phi = 6 h. At phi = 0 h the primary one-sided Day 1 test is inflated to 0.165 (MCSE 0.012), 3.3 times nominal, but the Day -1 check flags the pattern in only 0.092 (MCSE 0.009) of trials, so it misses most trials of that kind; at phi = 12 h it flags 0.112. A clean Day -1 check does not rule a residual time pattern out.
| Phase | Noise-free area, ms | Day 1, one-sided | Day 1, two-sided | Day -1 check, two-sided |
|---|---|---|---|---|
| phi = 0 h | 0.97 | 0.165 | 0.105 | 0.092 |
| phi = 6 h | -3.10 | 0.000 | 0.603 | 0.576 |
| phi = 12 h | -0.97 | 0.012 | 0.103 | 0.112 |
| phi = 18 h | 3.10 | 0.701 | 0.557 | 0.564 |
| No residual pattern (KA1) | 0.00 | 0.046 | 0.050 | 0.050 |
SAP text
"Before the C-QTc analysis, delay between concentration and ddQTcF will be assessed by the mean signed area of each participant's concentration-ddQTcF loop, computed on residuals from the prespecified direct-effect model with concentrations scaled to each participant's Cmax. Because ddQTcF subtracts the same time-matched placebo mean from every active participant, the mean area will be tested with a t-test whose standard error adds the variance from the placebo mean (from each placebo participant's signed area, about the placebo mean, against the active participants' mean scaled concentration profile), with Welch-Satterthwaite degrees of freedom; one-sided alpha set in the SAP. If each participant's ddQTcF is corrected by their own placebo period, a participant-level sign-flip test will be used instead (exact for 20 or fewer participants per dose, otherwise 9,999 random sign vectors). The tmax gap will be reported alongside, and a Day -1 pseudo-loop check will be reported. Evidence of delay leads to consideration of an effect-compartment model."
A significant result prompts an effect-compartment model (Sheiner et al. 1979) or a metabolite explanation. It does not replace the C-QTc analysis. A non-significant result in a study with a small placebo group is weak evidence of no delay (KA3, KA4).
Mock shells that report it, in the TLF libraries (pseudocode; the SAS twins are not executed, no license):
- sad/f_cqtc_hysteresis.R · .sasFigure 14.3.5.4: mean ddQTcF against mean concentration in time order, one panel per dose
- sad/t_cqtc_hysteresis.R · .sasTable 14.3.5.5: n active and placebo, A-bar (95% CI), placebo-adjusted p values, tmax gap, model for f, Day -1 check
- mad/f_cqtc_hysteresis.R · .sasFigure 14.3.6.4: the same, for each profile day
- mad/t_cqtc_hysteresis.R · .sasTable 14.3.6.5: by dose and profile day
What it does not do
- It does not replace the prespecified C-QTc model, its estimate of the effect at the geometric mean Cmax, or effect-compartment modeling. It decides only whether those need a delay term.
- It is conditional on the form of f. It removes curvature that the prespecified model describes (linear or Emax here); curvature the model misses can still look like a loop, as the raw area does under Emax.
- Its size is not exact. Every active participant's ddQTcF shares the time-matched placebo mean, so the Ai are dependent and the test is a Welch-type t-test whose size was checked only on these synthetic designs: 0.046 with 32 active and 8 placebo participants and 0.048 with 6 and 8 (MCSE 0.007). The participant-level sign-flip test is exact only when each participant's ddQTcF uses their own placebo profile; applied to pooled-placebo ddQTcF it rejected in 0.236 of trials with no delay. With an estimated Emax curve the test was slightly conservative, at 0.036.
- Its power is set mostly by the placebo group. With 8 placebo participants the placebo-mean term is most of the variance of A-bar (the two groups' areas have a similar spread, so with a quarter as many placebo participants it is about four fifths): power at ke0 = 0.7 per h was 0.489, against 0.876 with 32 placebo participants.
- It does not estimate the delay. The area grows with the effect size and depends on the sampling times around tmax; it is a test, not a ke0 estimate.
- The synthetic concentrations have no assay error, every participant shares the nominal grid, placebo and active participants have the same noise SD, and multiple-dose steady state was not simulated. Those were not studied.
- A residual time pattern, a period effect or any other time pattern left in ddQTcF can produce a loop with no drug delay. The Day -1 check detects such a pattern only if Day -1 is processed the same way as Day 1, and even then it often misses it (NC2).
- Nothing here is validated or a regulatory deliverable. The R and SAS shells were written by the same author (no independent double programming), the SAS is not executed, and every dataset is synthetic.
Provenance and credit
Established prior art, credited first.
- ICH E14 (May 2005), E14 Q&A (R3) (10 Dec 2015; Q5.1 on concentration-response modeling) and E14/S7B Q&As (Step 4, 21 Feb 2022).
- Garnett C, Bonate PL, Dang Q, et al. Scientific white paper on concentration-QTc modeling. J Pharmacokinet Pharmacodyn 2018;45(3):383-397, doi:10.1007/s10928-017-9558-5; correction 45(3):399, doi:10.1007/s10928-017-9565-6.
- Sheiner LB, Stanski DR, Vozeh S, Miller RD, Ham J. Simultaneous modeling of pharmacokinetics and pharmacodynamics: application to d-tubocurarine. Clin Pharmacol Ther 1979;25(3):358-371, doi:10.1002/cpt1979253358 (the effect compartment).
- Louizos C, Yáñez JA, Forrest ML, Davies NM. Understanding the hysteresis loop conundrum in pharmacokinetic/pharmacodynamic relationships. J Pharm Pharm Sci 2014;17(1):34-91, doi:10.18433/j3gp53 (review).
- Zhong Y. Development of hysteresis analysis as a model-independent approach to assess temporal dissociation in pharmacokinetics and pharmacodynamics. PhD dissertation, Washington State University, 2016, hdl:2376/12054 (model-independent loop metrics, including the loop centroid).
- Upton RN, Doolette DJ. A quantitative alternative to the hysteresis plot for measurement of drug transit time. J Pharmacol Toxicol Methods 2002;47(1):45-51, doi:10.1016/s1056-8719(02)00207-1 (a model-independent area method).
- Wang J, Li W. Test hysteresis in pharmacokinetic/pharmacodynamic relationship with mixed-effect models: an instrumental model approach. J Biopharm Stat 2014;24(2):326-343, doi:10.1080/10543406.2013.859149 (a formal model-based hysteresis test).
- Cyclicity analysis, where the signed area between two series measures which leads: Baryshnikov Y, Schlafly E. Cyclicity in multivariate time series and applications to functional MRI data. 2016 IEEE 55th Conference on Decision and Control, 1625-1630, doi:10.1109/CDC.2016.7798498; Giusti C, Lee D. Iterated integrals and population time series analysis. arXiv:1811.03558 (2018).
- Welch BL. The generalization of "Student's" problem when several different population variances are involved. Biometrika 1947;34(1-2):28-35, doi:10.1093/biomet/34.1-2.28; Satterthwaite FE. An approximate distribution of estimates of variance components. Biometrics Bulletin 1946;2(6):110-114, doi:10.2307/3002019 (the degrees of freedom).
- CiPA Phase 1 ECG biomarker validation study, NCT03070470, statistical analysis plan (March 2017), section 5.2.1: a one-sided one-sample Wilcoxon test at the 1% level combined with a time gap of more than 1 hour between tmax and the largest mean effect.
- Registry statistical analysis plans for dedicated QTc studies, NCT06215521 (section 6.2.1) and NCT04818229 (section 6.1.1): hysteresis judged from the hysteresis plot (a counterclockwise loop), with a delay of more than 1 hour between the peak ddQTcF and tmax among the conditions.
What is new here is small: the area computed on residuals from the prespecified direct-effect model, so the check is conditional on the form the SAP already names; a test whose standard error allows for the time-matched placebo mean that every active participant's ddQTcF shares, with the exact sign-flip test kept for designs where nothing is shared; documented operating characteristics, including where the raw area fails under a curved direct effect, how much a one-sample test overstates significance with a pooled placebo, and how far the placebo group limits power; and the Day -1 confound check, with its weakness shown.
Provenance note. The framing, splitting a lag-1 cross-moment into symmetric and antisymmetric parts with a time-reversal null, follows my author draft Anticipating Network Contagions: When Directedness Outperforms Connectedness (with the editor at Applied Network Science; author draft 5 July 2026; github.com/patrickiben/directed-asymmetry-contagion).
Rerun it
Rscript cqtc_hysteresis/R/run_oc.R        # from the repository root; about 3 minutes; rewrites out/ and this page
Rscript cqtc_hysteresis/tests/test_area.R # geometry, exactness, the placebo-mean identity, known answers and the shell gates
- R/sim.Rdata-generating model, with the pooled placebo group
- R/area.Rarea, fits, placebo-adjusted t, sign-flip and bootstrap tests, tmax gap
- R/run_oc.Rscenarios, seeds and outputs
- tests/test_area.Rtests
- out/oc_results.csvscenario, n active and placebo, seed, method, rejection rate, MCSE, exact 95% interval
- out/noise_free_areas.csvnoise-free typical-participant areas
Run with R version 4.6.0 (2026-04-24), base R plus nlme (only for the random-intercept comparison in the tests). Two consecutive runs wrote byte-identical files. The direct-effect fits estimate the participant intercepts as fixed effects (profile least squares); because a constant has no area, the intercepts never change Ai, and the tests compare the Emax result with an nlme random-intercept fit.