Auto-coding
meddra_app.py
- Reads
- The one verbatim column you select (
AETERMor a synonym), plus a dictionary as a flattened CSV or an.ascrelease. - Writes
ae_coded.csv(top three candidates per verbatim, with the LLT to SOC path) andaudit_log.csv.
Portfolio project · Patrick Iben, biostatistician
Four independent Streamlit apps that read clinical eCRF extracts and write audit-ready outputs: auto-coding of adverse-event verbatims, PII/PHI flagging and redaction, participant safety and discontinuation risk scoring, and data anomaly and drift detection. Each app is a separate program with its own audit log, so a run can be reproduced from its audit alone.
Synthetic data only. Everything bundled with these apps is synthetic: no real patients, no real study and no licensed dictionary. The demo dictionary uses 99-prefixed placeholder codes; it is not MedDRA.
Each app runs as its own Streamlit Community Cloud deployment in hosted mode: every data input is locked to the
bundled synthetic cut, outputs go to a per-session temporary folder, a banner says so on every page, and the audit
records hosted_mode=true. For real data, run the apps locally (see the README).
meddra_app.py): MedDRA-style auto-coding of adverse-event verbatimsphi_app.py): PII/PHI flagging and redactionrisk_app.py): participant safety and discontinuation risk scoringanomaly_app.py): numeric outliers, distributional drift and text outliersEach opens on the bundled synthetic sample data; click Execute to run it. An app that has been idle may take about 30 seconds to wake up.
The coding, PHI and risk apps read the same synthetic cut folder without interfering; the anomaly app reads its
own longitudinal demo, because drift needs a time axis. All four accept CSV, and SAS .sas7bdat when
pyreadstat is installed.
meddra_app.py
AETERM or a synonym), plus a dictionary as a flattened CSV or an .asc release.ae_coded.csv (top three candidates per verbatim, with the LLT to SOC path) and audit_log.csv.phi_app.py
phi_flags.csv (one row per scrubbed span), sanitized/<domain>.csv and audit_log.csv.risk_app.py
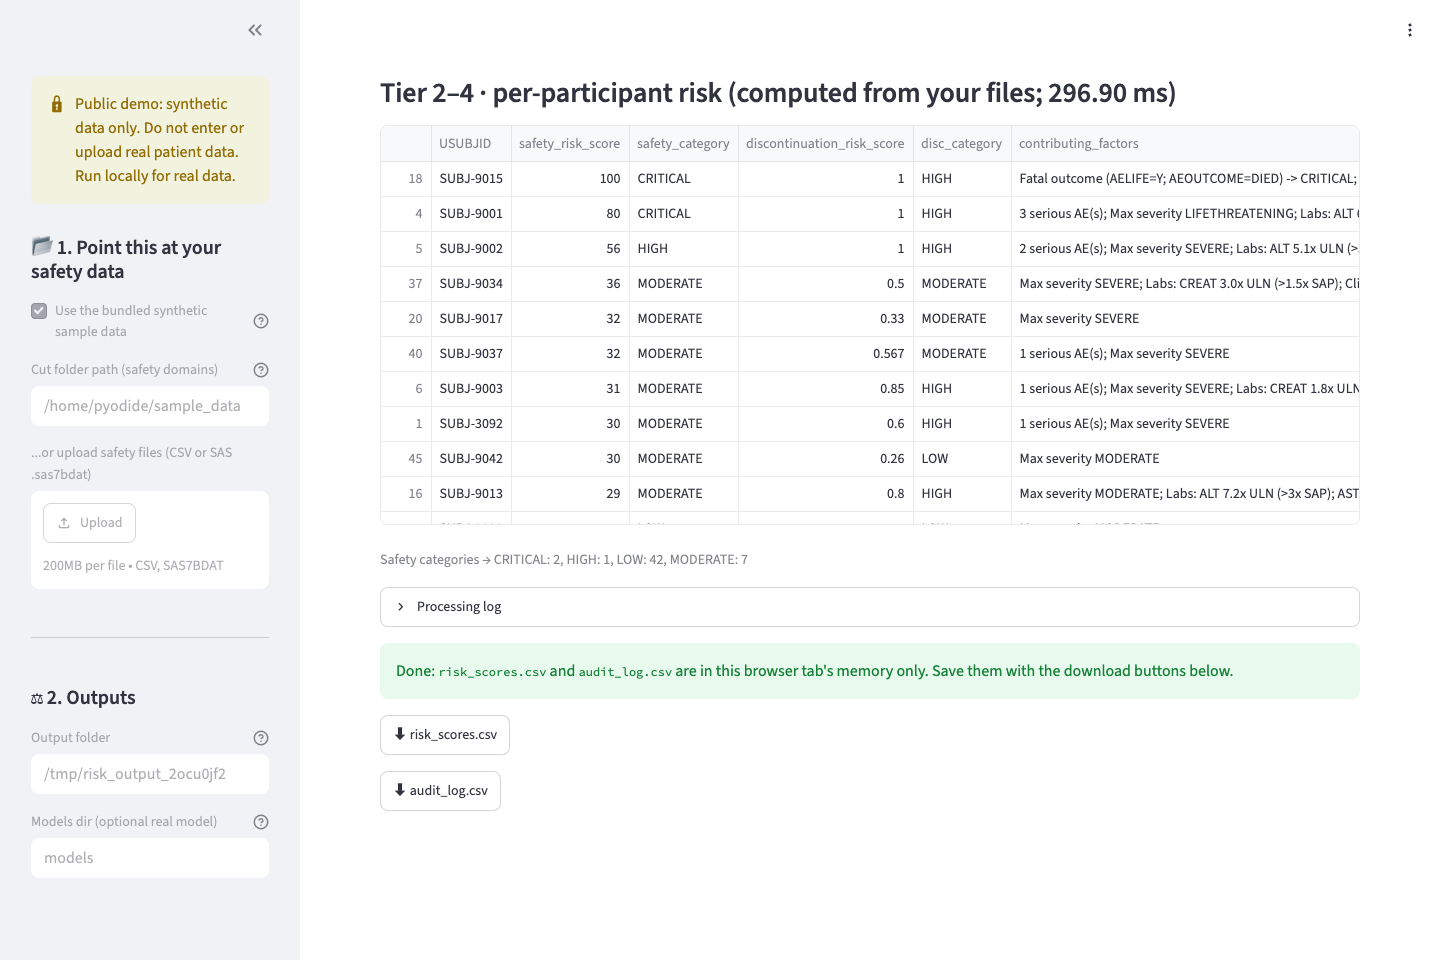
ae, lb, eg, vs, pe), classified by content and scored against built-in [SI] criteria. No SAP file.risk_scores.csv (safety and discontinuation scores with contributing factors) and audit_log.csv. Decision support, not a clinical determination.anomaly_app.py
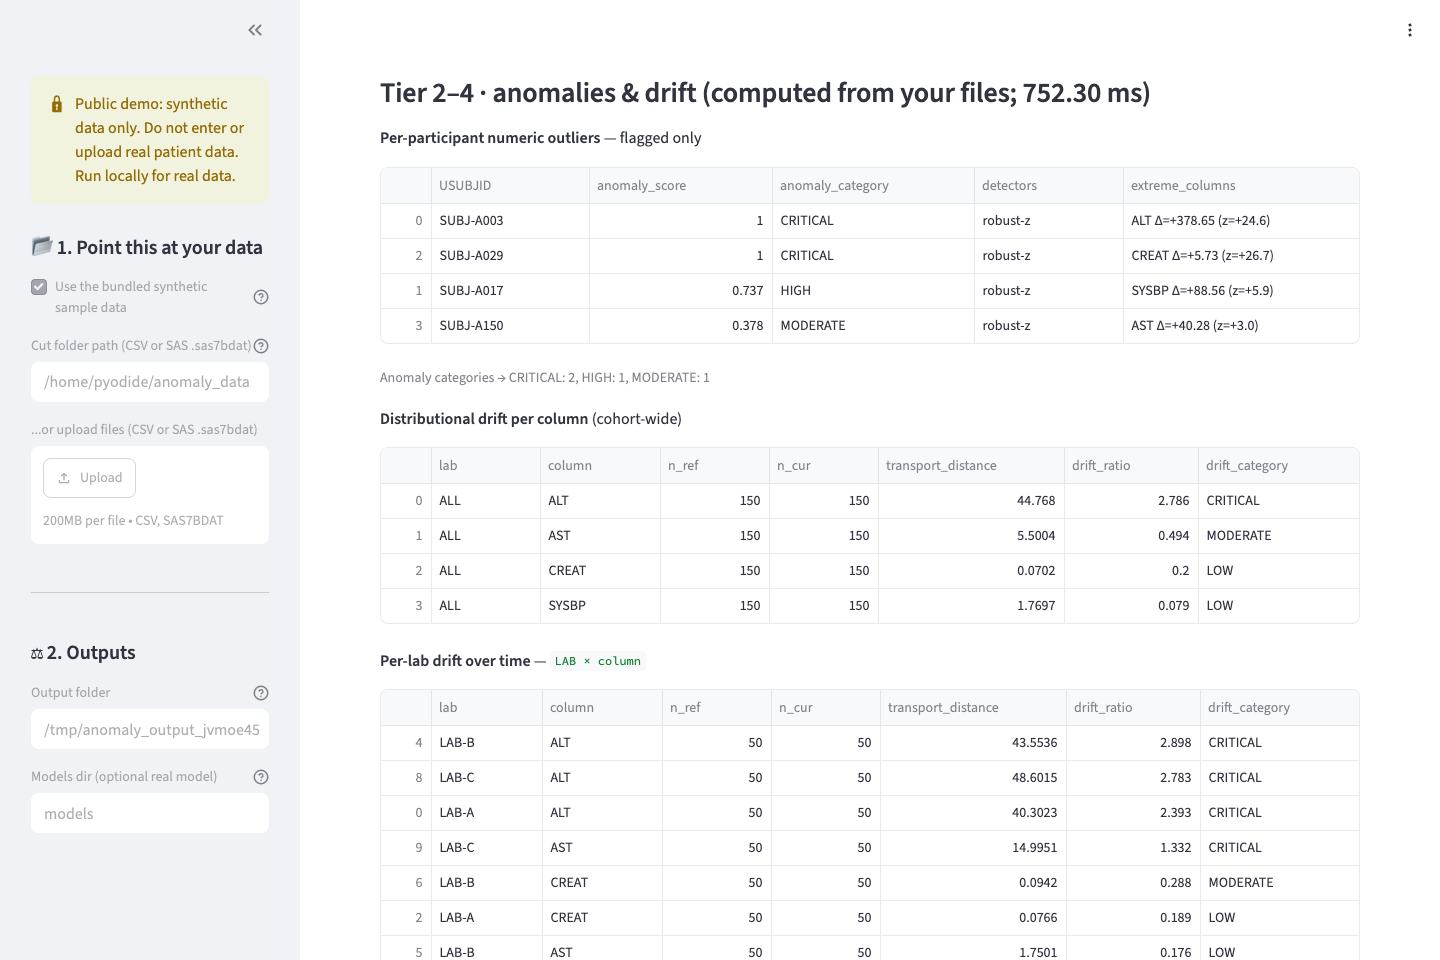
USUBJID: numeric columns, plus optional visit, lab/site and free-text columns.anomalies.csv, drift.csv, lab_drift.csv, lab_compare.csv, text_anomalies.csv and audit_log.csv.Every app runs the same discipline: four tiers in sequence, each handing named, readable columns to the next, so a decision is a row of numbers a reviewer can inspect and its threshold is a parameter a reviewer can move.
[SI] versus realNo trained weights ship with this repository, so the model tiers run as labeled deterministic stand-ins, tagged
[SI] in the banner and in every audit row, with the same output columns the real components would
produce. Run locally with the open-source runtimes (Cactus Needle3, hnswlib, Laya, XGBoost) and a models dir, and the
coding and PHI apps switch to their real path tier by tier, air-gapped; a tier shows REAL only when its artifact loads,
and an artifact that cannot be used stops the run rather than being replaced by a stand-in. What the real path does on
synthetic data is measured in the evaluation: better than the stand-in on misspellings and
untitled names, no better on colloquial verbatims, and about 0.4 s per verbatim on a CPU. Optional packages also turn on
real paths in the anomaly app: scikit-learn adds an Isolation Forest, and
POT with scipy runs Sinkhorn optimal-transport drift.
Local runs on the bundled synthetic data, opened with ?demo=1 and captured after Execute. Select an image to open it at full size.
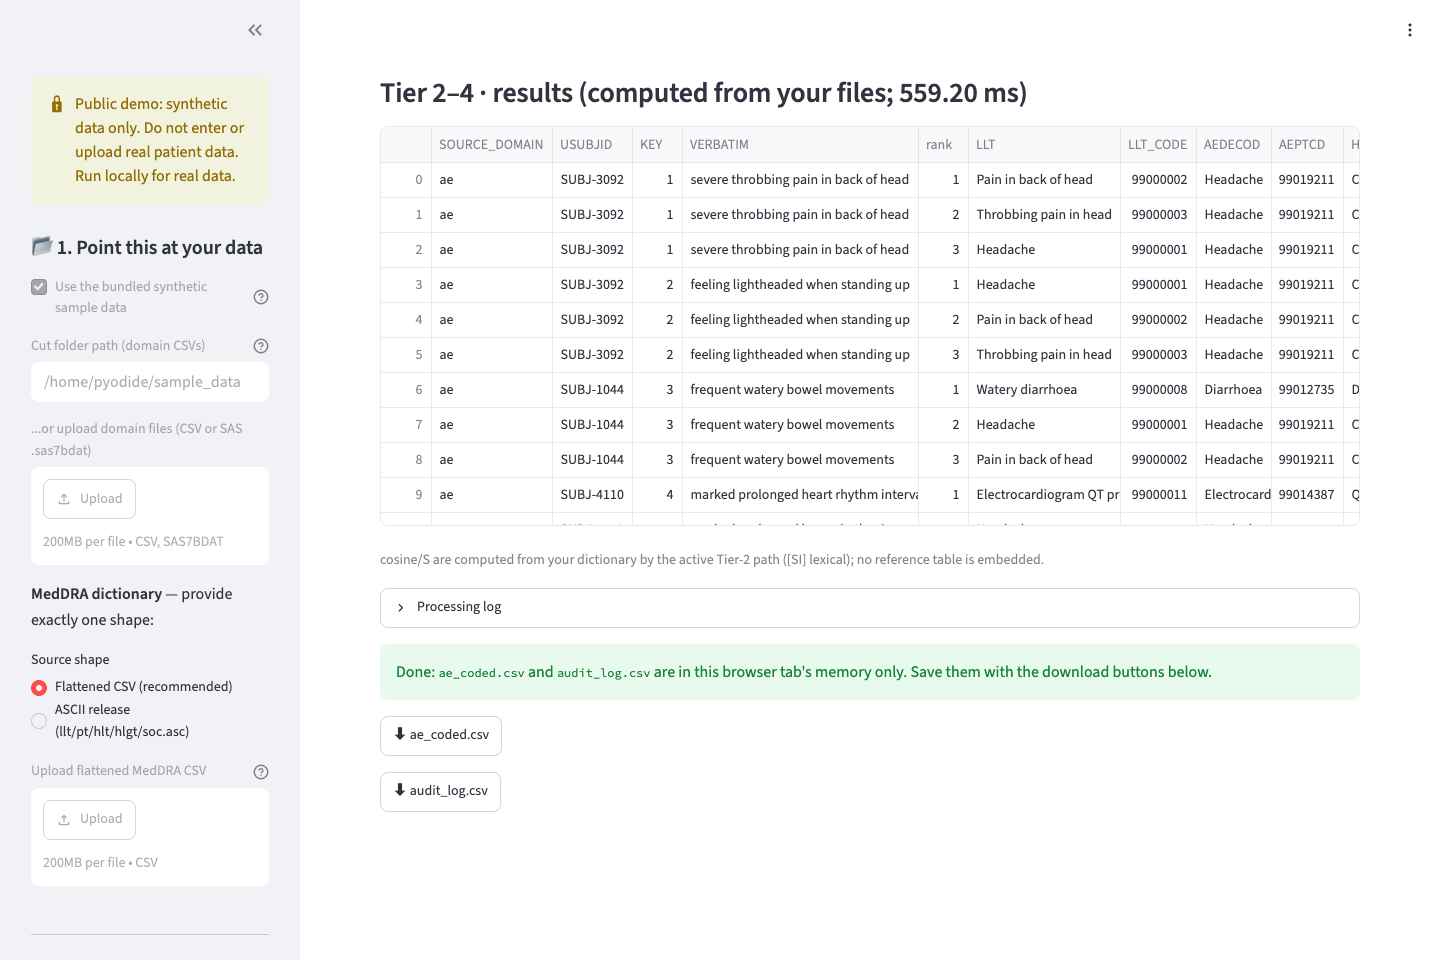
[SI] lexical stand-in.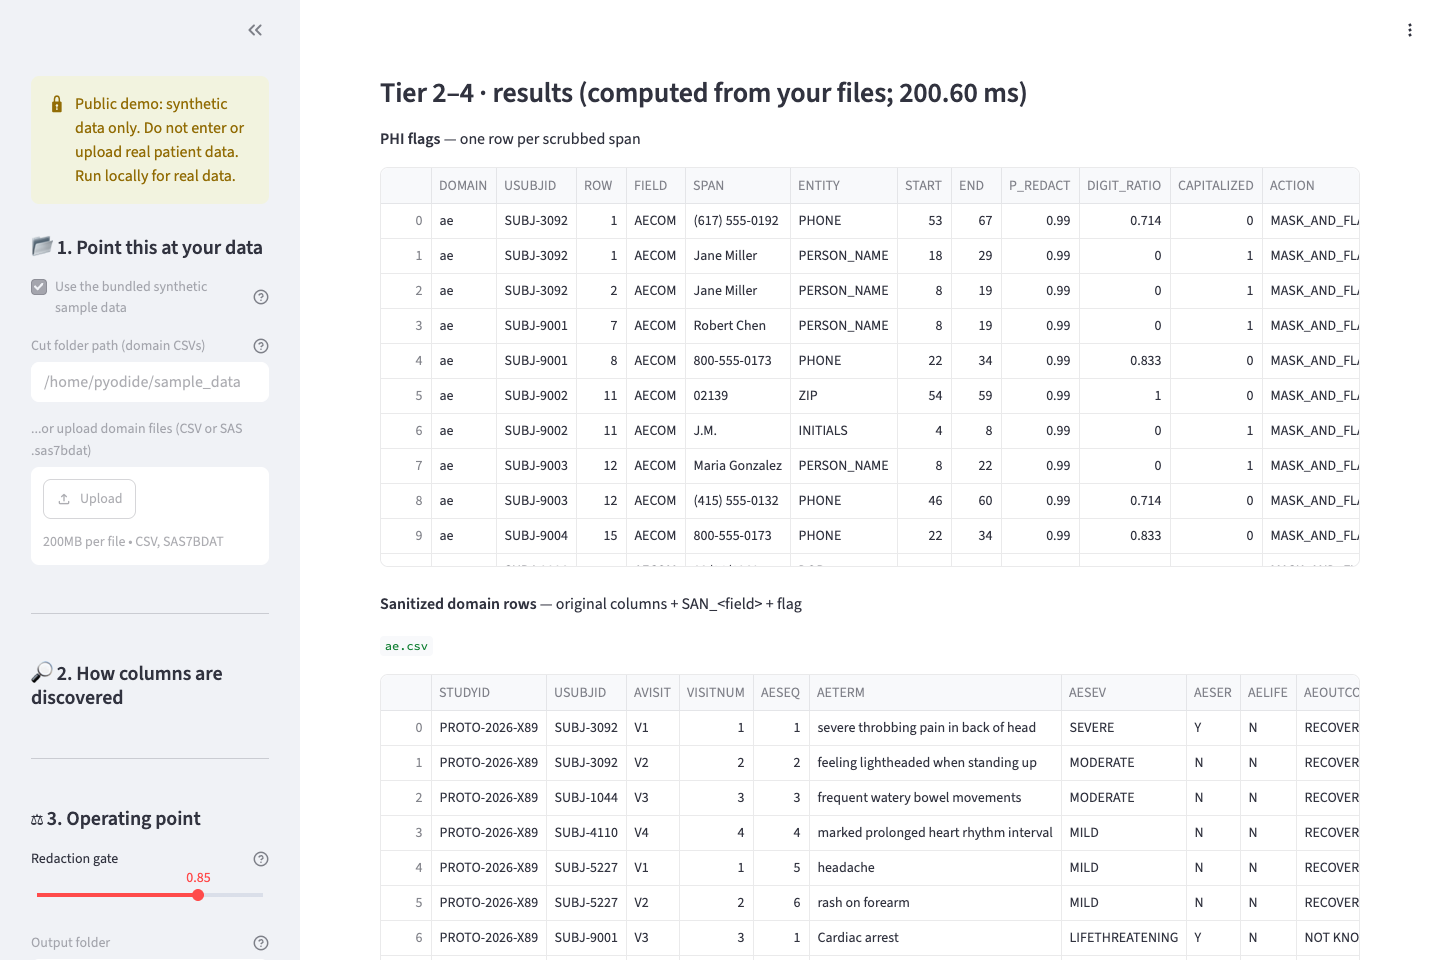
Use the arrow keys or the buttons at the bottom of each deck to move between
slides. Links inside the decks to their Markdown versions and to other repository files work only from the
decks in presentations/ in the GitHub repository, not from this site.
This is a single static file, docs/index.html, with no external scripts, stylesheets or fonts. GitHub
Pages serves it from the main branch's /docs folder.